What is SPC?

SPC DEMO
Don’t miss out! Book a demo of our specialized SPC software and unlock immediate improvements in your processes.
SPC Tools – Empirical Rule Chart, PP and PK Fallout Rates
Looking for convenient SPC tools? Take a look at our SPC Pocket Card which contains additional resources, including empirical rule chart and Ppk fallout rates, and keep it handy for future reference.
SPC Tools
Monitor your quality control process with advanced SPC tools. Use an empirical rule chart, Pp and Ppk Fallout Rates tables and more control charts. InfinityQS Proficient delivers many SPC tools for businesses in need of process optimization and quality control. The following charts serve as additional SPC tools and resources, including Pp and Ppk fallout rates, control chart constants, empirical rule chart, capability study and capability formulas.
Pp and Ppk Fallout Rates
| Calculated Capability Ratio | Pp Fallout (both sides combined) |
Ppk Fallout (one side only) |
| 0.50 0.60 0.70 0.80 0.90 1.00 1.10 1.20 1.30 1.40 1.50 1.60 1.70 1.80 1.90 2.00 |
133,620 71,860 35,730 16,396 6,934 2,700 966 318 96 26 7 2 0.340 0.060 0.012 0.002 |
66,810 35,930 17,865 8,198 3,467 1,350 483 159 48 13 3 1 0.170 0.030 0.006 0.001 |
Control Chart Constants
| X and R Control Charts | X and S Control Charts | ||||||||||||||||||||||
|
|
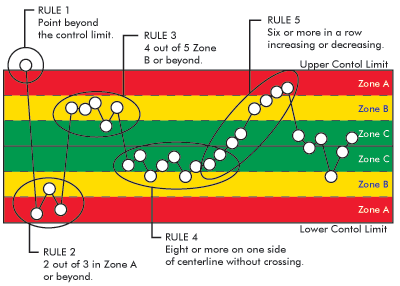
Special Cause Rules

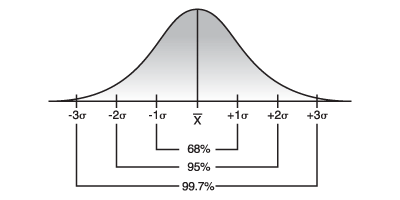
Empirical Rule

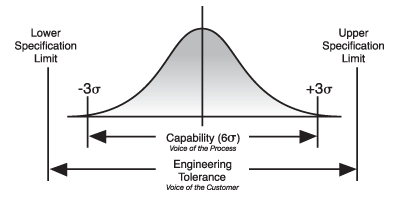
Capability Study

ProFicient™, the leading real-time Quality Management solution, goes beyond typical site-based quality applications by offering an enterprise-ready architecture and statistical process control. Still have questions or need help with SPC tools? Contact us today for more information about our SPC software. It’s time to re-imagine your quality control process.
Speak to a Distribution Industry Expert
What to Expect
- Free 20-minute call with a product expert
- Explore which solutions best suit your needs
- No-pressure conversation
- Get a live, personalized demo


