
What is the difference between subgroup size, subrange size, and sample size in WinSPC? You will find the answer to that question in this article.
Subgroup Size/Subrange Size
The term subgroup size applies to a variable characteristic and controls how many samples (also called data values or individual readings) make up a single plotted point on a control chart (called a ‘subgroup’). The subgroup size can be any whole number (integer) greater than or equal to 1.
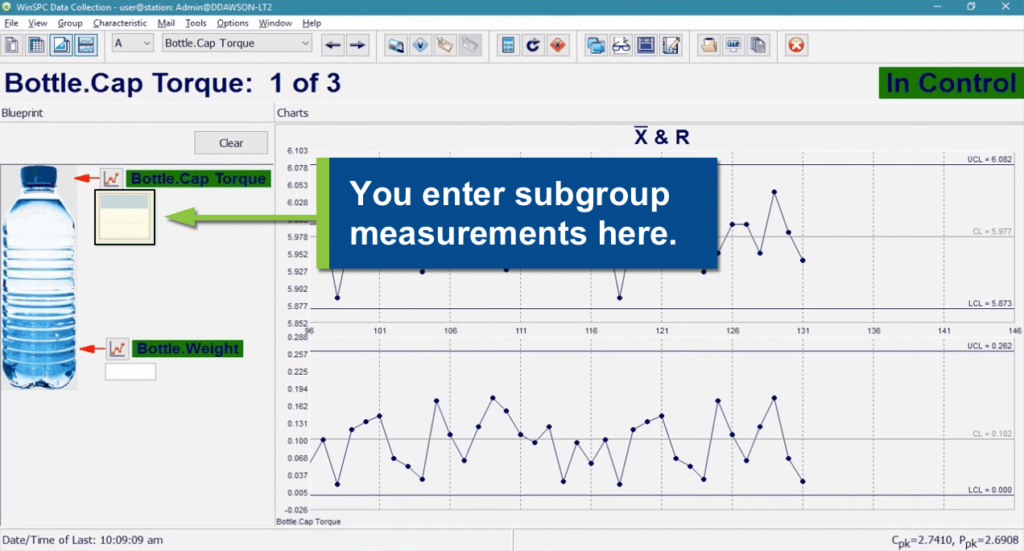
If your subgroup size is 2 or greater, you will often use an ‘X-Bar & R’ or ‘X-Bar & S’ control chart when displaying your data. The subgroup plotted on the ‘X-Bar’ chart represents the average of the samples of that subgroup. For an ‘R’ chart (‘Range’ chart), the subgroup represents the range of the samples in the subgroup (the largest sample value minus the smallest sample value). For an ‘S’ chart (‘Standard Deviation’ chart), the subgroup represents the standard deviation of the samples in the subgroup.
WinSPC Means Lower Costs and Higher Quality
WinSPC is software to help manufacturers create the highest quality product for the lowest possible cost. You can learn more here.
If your subgroup size is 1, an ‘X & MR’ chart is commonly used to display the data. On the ‘X’ chart, the subgroup represents each individual sample, while on the ‘MR’ chart (‘Moving Range’ chart), the subgroup represents the range of the values of consecutive subgroups. The number of subgroups taken into account when calculating the moving range value is controlled by the subrange size.
The subrange size must be a whole number that is 2 or greater and is only applicable when the subgroup size is 1. For example, if your subgroup size is 1 and your subrange size is 3, then the plotted value for any subgroup on the ‘MR’ chart is the largest ‘X’ value of the previous 3 ‘X’ subgroups (including the current subgroup) minus the smallest ‘X’ value of the previous 3 ‘X’ subgroups (including the current subgroup).
Both the subgroup size and subrange size (if applicable) affect the statistical and control limit calculations for the variable.
In WinSPC, both the subgroup size and subrange size are configured in the variable setup (properties). A subrange size is only be defined if the subgroup size of 1.
Sample Size
The sample size, on the other hand, controls how many samples (or readings) are taken at a given point in time during the act of data collection. This is often the same as the subgroup size, but does not have to be. For example, lets say you measure the width of a part and you have your subgroup size configured to be 3.
You measure a part every hour, and you measure quite a few different characteristics of the part at this time, with just one of them being the width. In this case, in WinSPC, you could configure the sample size for the width step in your collection plan to be 1, so that after you take the width measurement on the part, the collection plan can then be ready for the next characteristic (i.e., height). In this example, it would take 3 parts to produce a point on the chart (since your subgroup size is 3).
Alternatively, if instead you took 12 parts off the production line to measure, and your subgroup size was still 3, you might set your sample size to 12. This would allow you to enter in all 12 samples for width (producing 4 subgroups on the chart) before moving on to the next characteristic.
In WinSPC, the sample size is configured in the collection plan setup (properties) and can vary based on the step in the collection plan (one step in the collection plan can have a different sample size than another step in the same collection plan).
The default sample size for all variable characteristics within collection plans is the same as the variable’s subgroup size.
About DataNet Quality Systems
DataNet Quality Systems empowers manufacturers to improve products, processes, and profitability through real-time statistical software solutions. The company’s vision is to deliver trusted and capable technology solutions that allow manufacturers to create the highest quality product for the lowest possible cost. DataNet’s flagship product, WinSPC, provides statistical decision-making at the point of production and delivers real-time, actionable information to where it is needed most. With over 2500 customers worldwide and distributors across the globe, DataNet is dedicated to delivering a high level of customer service and support, shop-floor expertise, and training in the areas of Continuous Improvement, Six Sigma, and Lean Manufacturing services.
Our Fact Checking Process
We prioritize accuracy and integrity in our content. Here's how we maintain high standards:- Expert Review: All articles are reviewed by subject matter experts.
- Source Validation: Information is backed by credible, up-to-date sources.
- Transparency: We clearly cite references and disclose potential conflicts.
Our Review Board
Our content is carefully reviewed by experienced professionals to ensure accuracy and relevance.- Qualified Experts: Each article is assessed by specialists with field-specific knowledge.
- Up-to-date Insights: We incorporate the latest research, trends, and standards.
- Commitment to Quality: Reviewers ensure clarity, correctness, and completeness.