Latest Articles
International Baker Pursues Perfection and Profits with WinSPC
One international baker chose WinSPC real-time statistical process control software to deliver real-time feedback to line operators at the point…

A reason to celebrate: November as World Quality Month
From sharing quality stories and anticipating the nature of quality efforts in the future, to ordering celebration kits with magnets…
The differences between control limits and spec (specification) limits
The differences between control limits and spec (specification) limits may seem irrelevant or nonexistent to those outside process production, but…
How Walmart Ensures Product Quality Through Traceability
Recently, product recalls have been dominating the news. From cars that don’t brake properly to pills that don’t properly release…
Why Statistical Process Control is Necessary for Your Organization
Imagine this scenario: a patient undergoes hip surgery, only to be told that the replacement product that was installed inside…
What is Manufacturing Quality Control?
Think of the amount of work required to transform a car from a random collection of assorted parts into the…

The Top 3 Benefits of Statistical Process Control Software for Quality Control
The next time you are walking through a store, take a moment to stop and look around. It can be…
Organizing Charts in Engineering Mode: The Matrix Style
You have four charts and only one computer screen. How do you consolidate to a multiple chart view to compare…
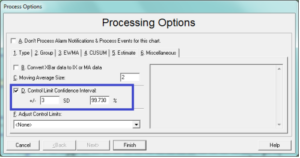
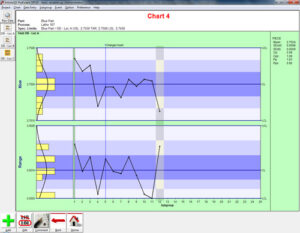
Modifying Control Chart Sensitivity
Control limits are typically set at +/- 3 standard deviations for the statistic being plotted. That‘s how traditional Shewhart control charts have…
Gage R&R study questions answered
We frequently entertain questions about MSA and specifically, gage R&R. Below are two questions we recently received: Question #1: “What are…