
The differences between control limits and spec (specification) limits may seem irrelevant or nonexistent to those outside process production, but the gulf between them is in fact huge. In fact, they are two entirely different animals.
Spec limits may be designated by a customer, engineer, etc., indicating the allowable spread of a given measurement. Control limits, on the other hand, emerge from the process. The process data will determine what control limits are and help determine the stability of the process.
If one is tempted to use spec limits as control limits, the advice from process engineers and statisticians as well is simple: Don’t.
For an X-bar chart, for example, such as the one illustrated below, all of the X-bar values are well within the designated spec limits. Things are fine, right?
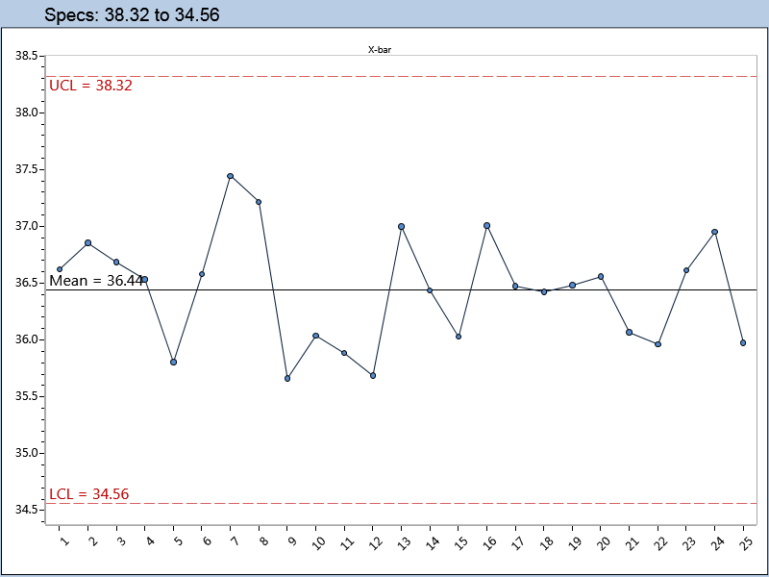
Not so fast. Remember that an “X-bar” is an average. And as PQ Development Manager Steve Daum points out, if you put one foot in a bucket of ice water and the other into extremely hot water, the average water temperature may be perfectly temperate, indicating a comfortable situation. In fact, the average does not reflect the range of the separate data points, one of which might be 33 degrees Fahrenheit, and the other 180 degrees. Comfortable? Probably not.
A histogram of the same process offers a much clearer picture of the reality of this process (see chart), with some data values well outside the specification limits, indicating an unacceptable result.

Let your data do the talking, when it comes to control limits. Don’t confuse information from the process with requirements for the process.
Our Fact Checking Process
We prioritize accuracy and integrity in our content. Here's how we maintain high standards:- Expert Review: All articles are reviewed by subject matter experts.
- Source Validation: Information is backed by credible, up-to-date sources.
- Transparency: We clearly cite references and disclose potential conflicts.
Our Review Board
Our content is carefully reviewed by experienced professionals to ensure accuracy and relevance.- Qualified Experts: Each article is assessed by specialists with field-specific knowledge.
- Up-to-date Insights: We incorporate the latest research, trends, and standards.
- Commitment to Quality: Reviewers ensure clarity, correctness, and completeness.