Control limits vs specification limits: specification limits are set by a customer or engineer and define the allowable spread of a measurement. Control limits are calculated from the process data itself and describe what the process actually does. A process can run inside its control limits and still produce parts outside specification, which is why the two should never be used interchangeably.

The differences between control limits and spec (specification) limits may seem irrelevant or nonexistent to those outside process production, but the gulf between them is in fact huge. In fact, they are two entirely different animals.
Control Limits vs Specification Limits: Definitions
Spec limits may be designated by a customer, engineer, etc., indicating the allowable spread of a given measurement. Control limits, on the other hand, emerge from the process. The process data will determine what control limits are and help determine the stability of the process.
Why Spec Limits Should Never Be Used as Control Limits
If one is tempted to use spec limits as control limits, the advice from process engineers and statisticians as well is simple: Don’t.
Example: An X-Bar Chart That Looks Fine
For an X-bar chart, for example, such as the one illustrated below, all of the X-bar values are well within the designated spec limits. Things are fine, right?
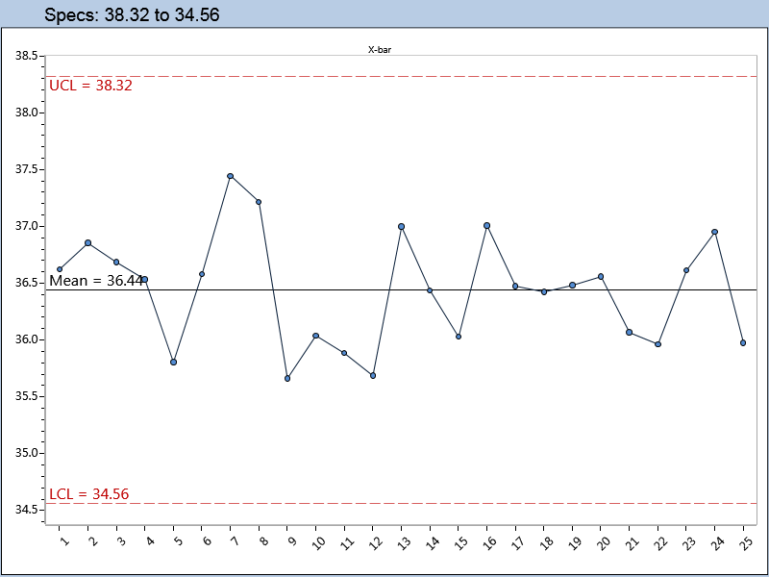
Not so fast. Remember that an “X-bar” is an average. And as Steve Daum, development manager for SQCpack at Advantive (formerly PQ Systems), points out, if you put one foot in a bucket of ice water and the other into extremely hot water, the average water temperature may be perfectly temperate, indicating a comfortable situation. In fact, the average does not reflect the range of the separate data points, one of which might be 33 degrees Fahrenheit, and the other 180 degrees. Comfortable? Probably not.
What the Histogram and Cpk Reveal
A histogram of the same process offers a much clearer picture of the reality of this process (see chart), with some data values well outside the specification limits, indicating an unacceptable result.

The capability statistics confirm it: Cp 0.46 and Cpk 0.43 against specification limits of 34.56 and 38.32. A Cpk below 1.0 means the process spread is wider than the specification, so out-of-spec parts are inevitable even though every X-bar point looked fine.
Let your data do the talking when it comes to control limits. Use control limits to judge whether a process is stable, use specification limits to judge whether its output is acceptable, and never put one on a chart in place of the other. Information from the process is not the same as requirements for the process.
See how SQCpack by PQ Systems calculates control limits from your data and reports Cp and Cpk against your specifications. Get a demo.