
The most significant release of WinSPC in years
Customers often find they need answers that localized sampling into SPC charts does not illuminate. Diverse, fast and complex manufacturing flows require tools that collect everything now, integrate information from all locations, and facilitate immediate, deep analysis. WinSPC 10 goes to the heart of this requirement. It collects and processes data at almost unimaginable speeds and offers high-powered, cutting-edge monitoring and analysis features that are capable of delivering real-time actionable intelligence to every operator, supervisor, and engineer in the plant.
Beyond that, WinSPC 10 boasts many enhancements that make its use both faster and easier, all specially selected to heighten the success of quality teams while lightening their load.
WinSPC 10 Notable New Content
High Performance Application Server
- High-Speed Data Collection
- Resilient Architecture with Tuning Tools
New Dashboard and Charts
- More Options for Customization
- Dashboards for Data Collection Stations
- Live Updates Anywhere
- Easy-to-Consume Stat Tables and Scrolling Marquees
New Analysis Options
- Multivariate Analysis (Box-and-Whisker, Overlay, Pareto, Correlation)
- Analysis of Variance (ANOVA)
Global Templates and Favorites to Speed Operations
- Common Tags
- Independent Data Filters
- Speedy Reuse with Favorites
NEW WinSPC 10 Video!
WinSPC 10 will include the following major enhancements
High Performance Application Server — High-Speed Data Collection
Data collection and decisions that are now faster than you ever imagined. Real-time analysis at hundreds of subgroups per second per client and tens of thousands per second per server.
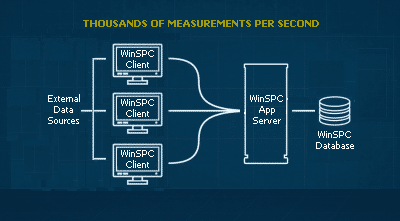
Powered by an entirely new processing framework, WinSPC 10 captures data orders of magnitude faster, enabling high-volume manufacturers to monitor processes in real-time and realize the dramatic savings promised by processes that are statistically in control — a fully automated solution that operates well beyond previously accepted limits.
- Captures and tests hundreds of data points per second per station
- Expands data-collection methods, making new streams of process or product data available for monitoring and analysis
- Solves 100% inspection challenges, even when working at break-neck production speed–perfect for vision, PLC and trace-data scenarios
High Performance Application Server — Resilient Architecture with Tuning Tools
Manufacturing happens in tough real-world environments and this application server has been enhanced to detect, adapt and overcome common failures that happen to even the best planned implementations. Visual server tools provide live views of hardware utilization and provide options to reallocate and maximize throughput of process streams to maximize use of available hardware. Integral database archival scheduling permits automating data retention plans to maintain a healthy fast primary database while retaining access to the history you still value.
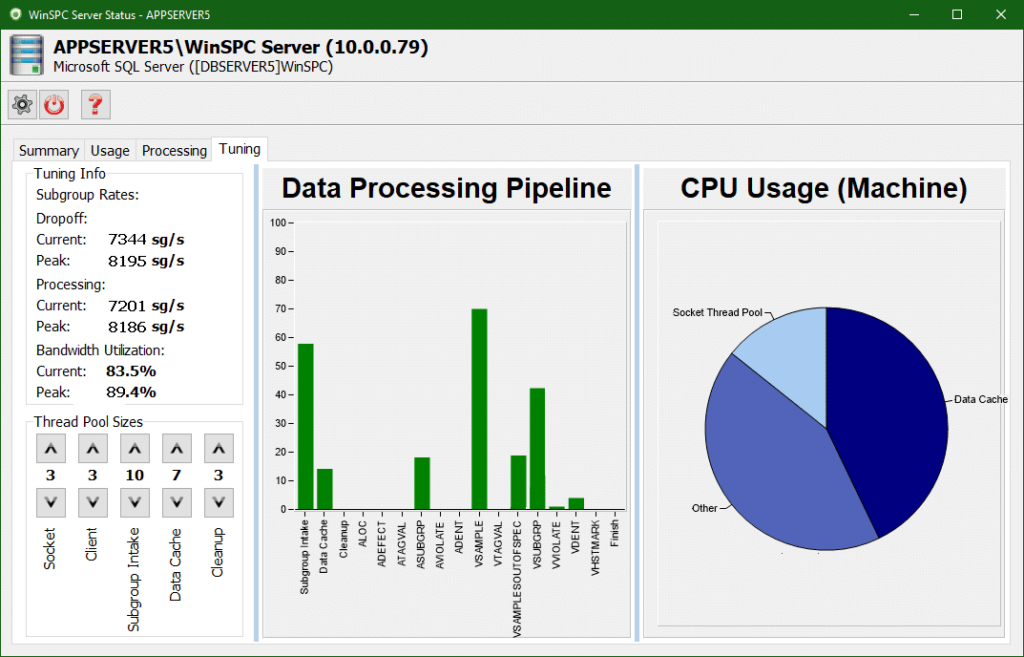
WinSPC is designed to deal with the problems inherent in real world operations recovering from events such as sudden power loss, storage volume disconnects, SmartUPS or Windows shut down events and many other unavoidable data collection interruptions, only to restart, rebuild and move on when the system again comes to life. New server management tools provide visualization of the data flows within the server and allow for tweaking parameters to optimize the allocation of resources to maximize your throughput.
- System tested to utilize 96 Cores, 384GiB RAM and 25Gbps network bandwidth with 150 data collection stations processing tens of thousands of readings per second (This is not an absolute software limit but the limits of the best available hardware at time of testing)
- Visually view the live state of the processing queues critical to responsive process control and reallocate threads and resources to meet the throughput priorities you’ve set for the system
- System automatically handles SmartUPS and Windows update notifications for orderly shutdown and restart without data loss
- Improved system hardening permits resiliency and recovery for many unplanned power and resource losses, allowing the system to restart, recover its state and resume operations with the most complete data still available
- Manages database performance and executes retention policies by migrating unneeded data to archival databases to keep the primary storage system operating at peak levels.
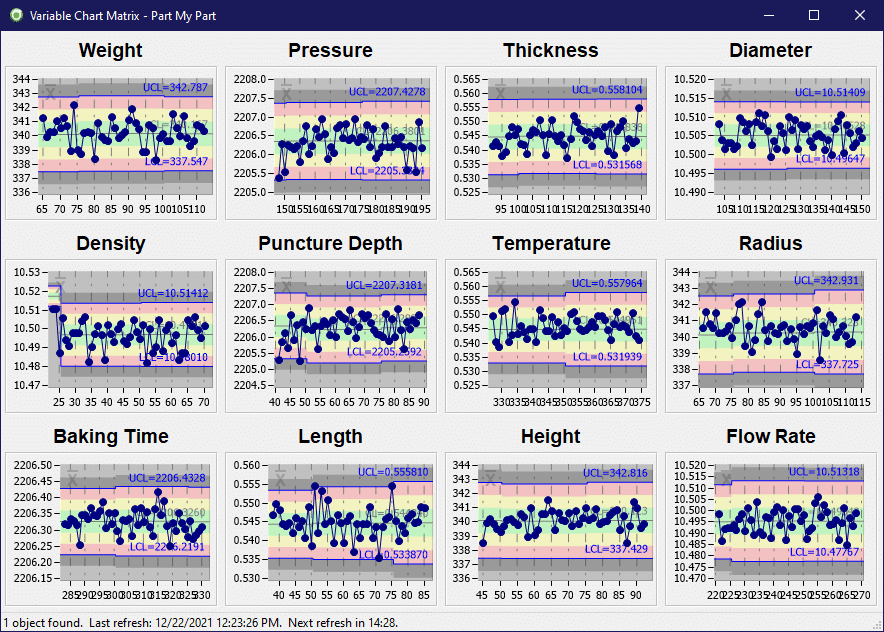
Dashboards and Charts — More Options for Customization
Easily configure chart appearance, function, and feedback for the individual needs.
WinSPC 10 charts can be customized more than ever before. Administrators can specify a chart’s title, the number of visible data points, and a comprehensive chart scheme. Users can momentarily toggle individual visual elements on or off and personalize charts on-the-fly in many other ways–all resulting in views perfectly tailored to communicate the most important details instantly.
- Configurable chart schemes provide granular control over chart properties
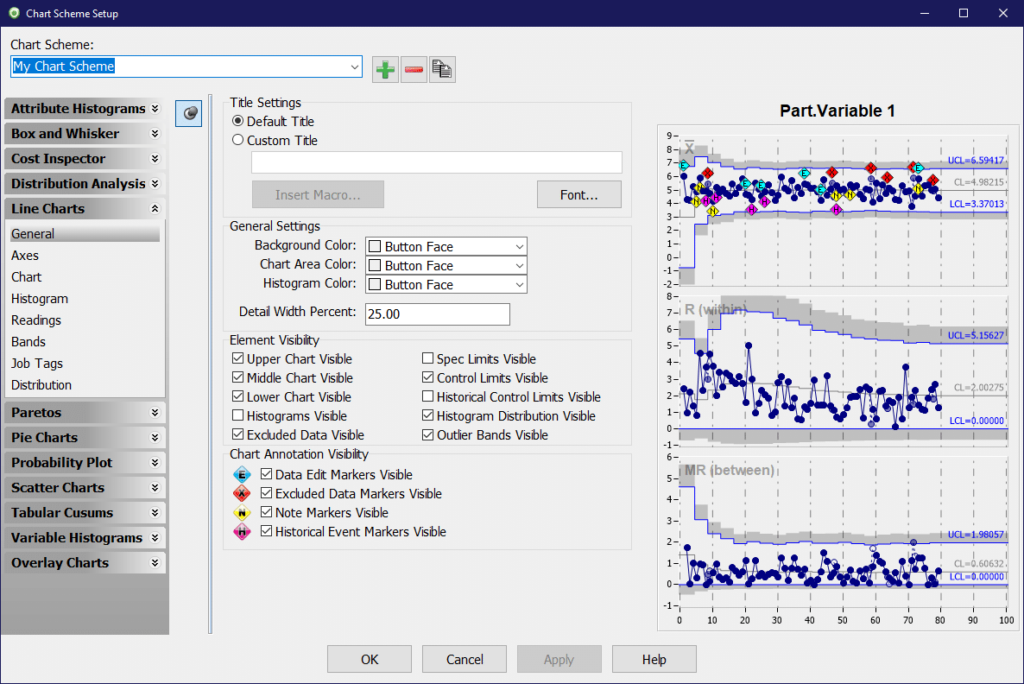
- New configuration options include colored bands based on current control limits, historical control limits, or spec limits
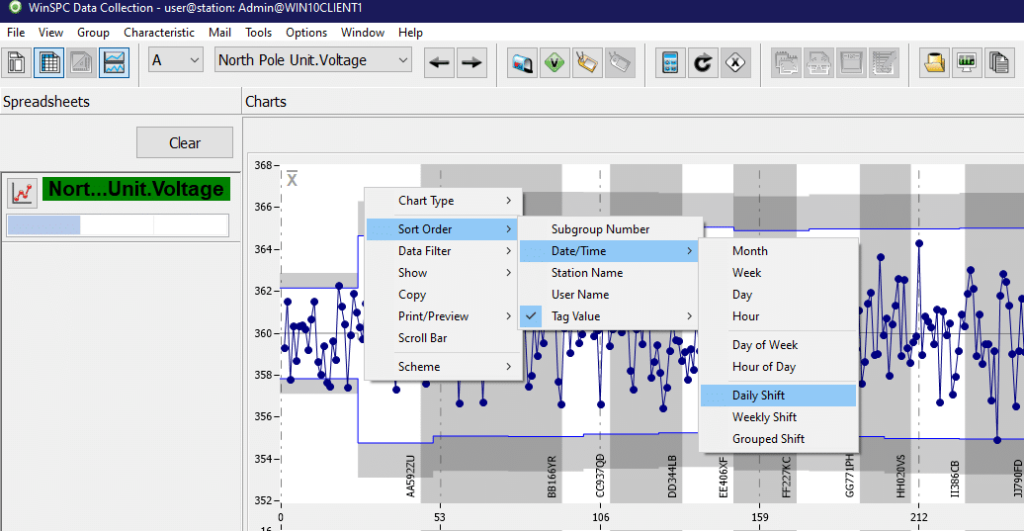
- New visualizations in WinSPC’s Data Collection window deliver dramatically increased real-time insight into processes
- Right-click menu ‘Sort Order’ option–new in the Data Collection window–groups data into different buckets for quick comparison
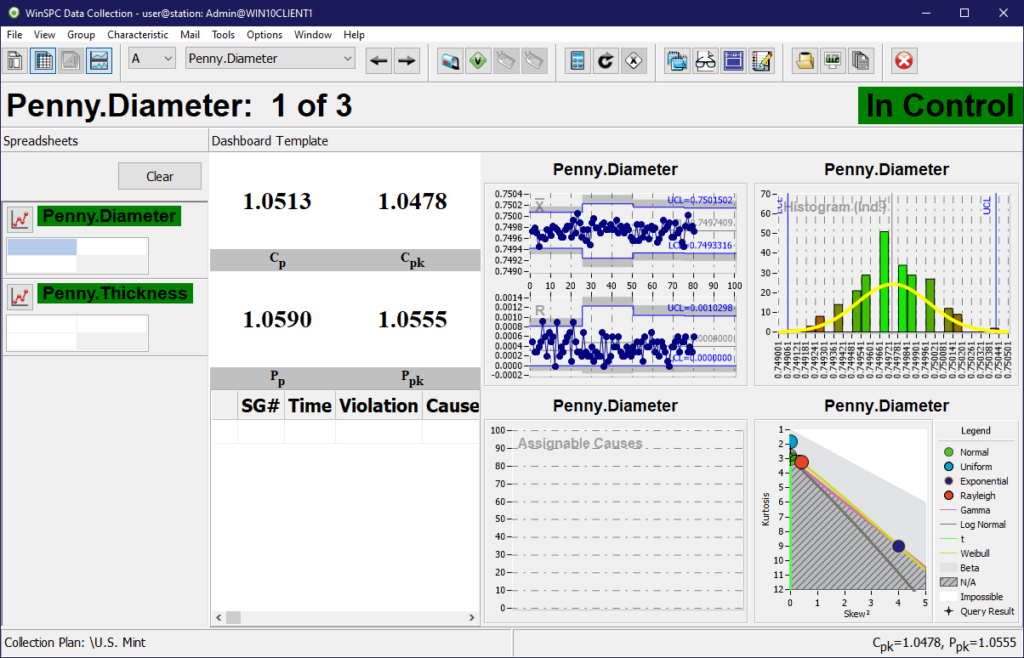
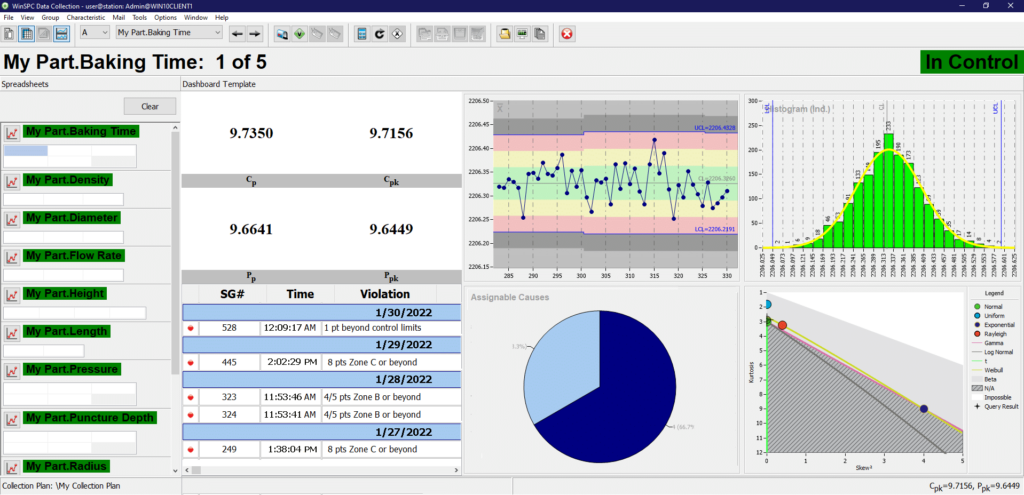
Dashboards and Charts — Dashboards for Data Collection Stations
Characterize real-time production status at any station using status widgets with live remote production statistics visible at all times.
As an alternative to monitoring traditional control charts during data collection, shop-floor personnel can now monitor dashboards. Dashboards bring new options for visualizing data as it is being collected: gauges, tables of vital statistics, lists of violations, and color-coded indicators. And dashboards can be setup to display live data from any operation in the plant, ushering in a brand new era of plant-wide visualization.
- Radically expands the types of items available in the Data Collection window beyond a panel of charts
- Ready-to-use dashboard templates provide a wide selection of views, sorted and filtered by date, shift, line, run, or other factors
- Dashboards in the Data Collection window can combine multiple charts and statistics into a single display that updates in real-time, and each component in a dashboard can have its own unique filter
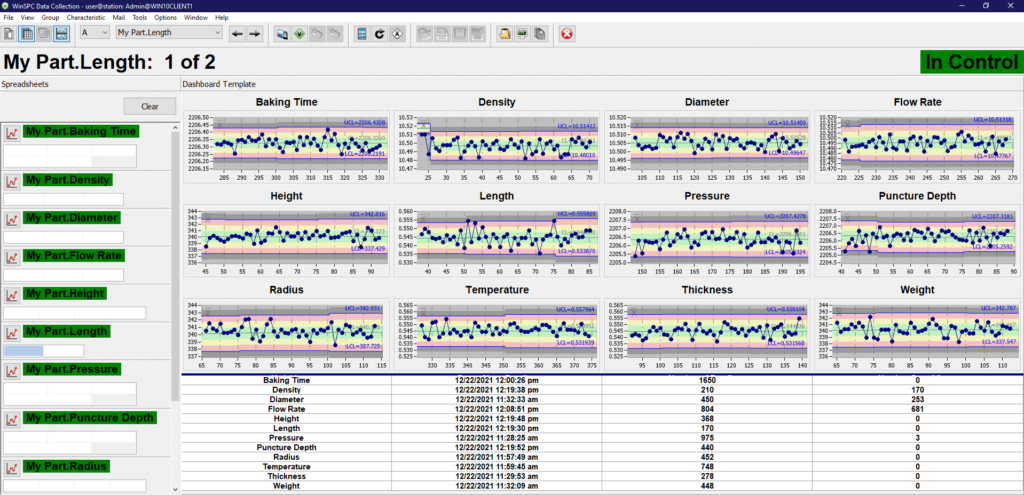
- Large status billboards are readily achievable with a matrix of 10, 20 or more charts or other components arrayed to communicate status to everyone on the floor
Dashboards and Charts — Live Updates Anywhere
See data being collected at other stations, regardless of location, while they see data being collected at yours.
WinSPC 10 includes the ability to feed real-time data to multiple stations. This means that a station can monitor upstream and downstream operations in the same way it monitors its own operation. Live feeds introduce a whole new level of coordination and integration on the shop floor.
- Feed critical operation data and statistics from your activities to stations throughout production
- See activity at upstream operations and prepare for downstream impacts
- Monitor identical machines in other locations for comparative value
- Eliminate in-person requests for updates on related processes
Dashboards and Charts — Easy-to-Consume Tables and Scrolling Marquees
Empower your dashboards with familiar tables and scrolling marquees that get the attention of production workers.
Vital information can now be laid out in a table or scrolling marquee, giving shop floor personnel more options for comparing statistics, configuration particulars, violations, assignable causes, corrective actions, and other information. The tables and marquees are simple to set up and can be customized to include the precise details that are important to you.
- New Stat Table component permits many columns to display various stats per variable, including filtering on each column
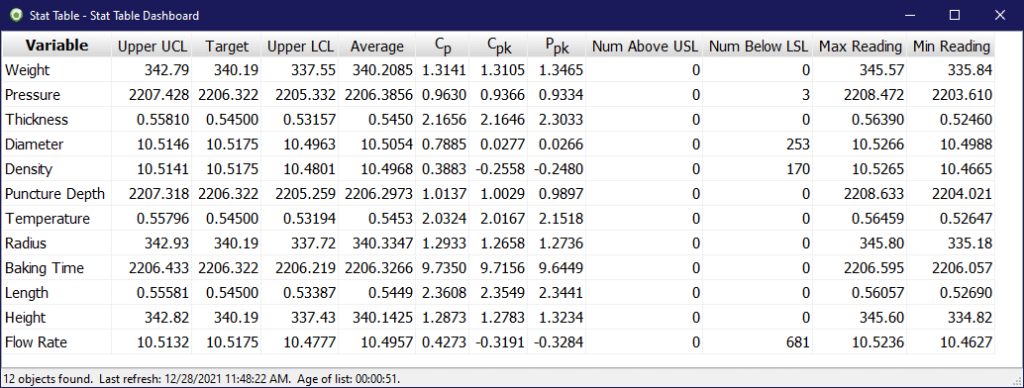
- Create dedicated grids to standardize the location and presentation of critical information or statistics
- Create a single dense organized view to encompass all relevant information for a station or an entire operation
- New Marquee component enables a stock ticker-like display, making it a great vehicle for operators and supervisors to get hands-free status and insights at a glance. Watch this short video to find out more.

- Design a display that rolls through plant-wide KPIs
- Port a scrolling matrix of live charts to a large monitor visible from everywhere on the shop floor
- Use marquees in individual work cells to cycle through relevant charts and stats
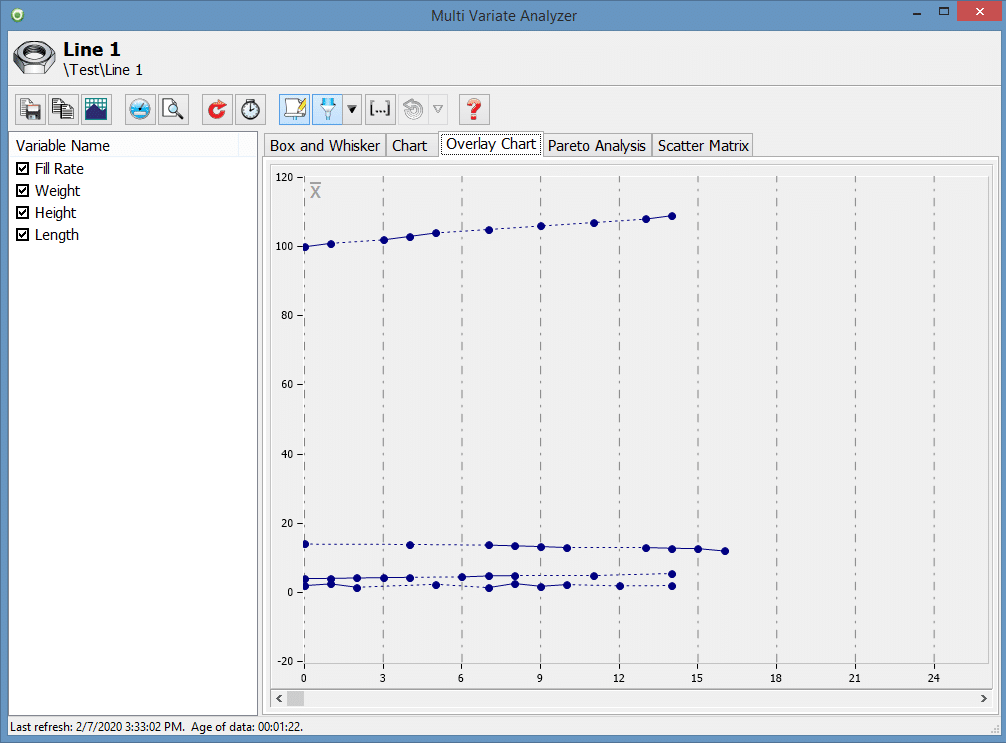
New Analytics Options — Multivariate Analysis
Turn hunches about variable and production factors into documented evidence on which to act.
New multivariate analysis tools enable quality practitioners to simultaneously examine two or more variables, providing a means of comparing process inputs for their impact on resulting product quality. Multivariate analysis exposes relationships between variables that, in many cases, point to hidden, highly profitable process improvement opportunities.
- Compare relationships among variables and correlate data sets to see which process variables may have the biggest impact on final product quality
- The Overlay chart now shows data lines for multiple variables in a single chart
- The Scatter Matrix now illuminates correlations between variables and calculates the R value to determine a positive or negative correlation
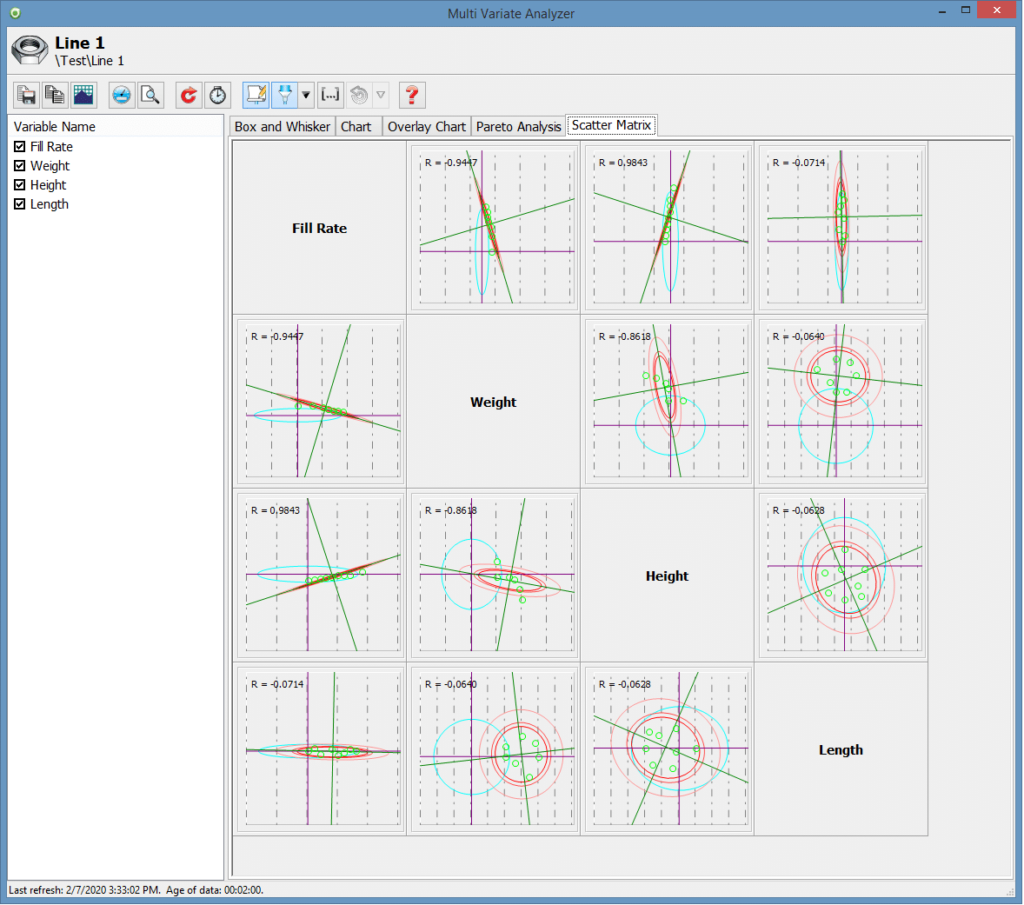
- The Box & Whisker now sorts using tagged values for side-by-side views of various production factors
New Analytics Options — One-Way ANOVA Studies
Let WinSPC detect and propose additional comparisons using parameters recorded during data collection.
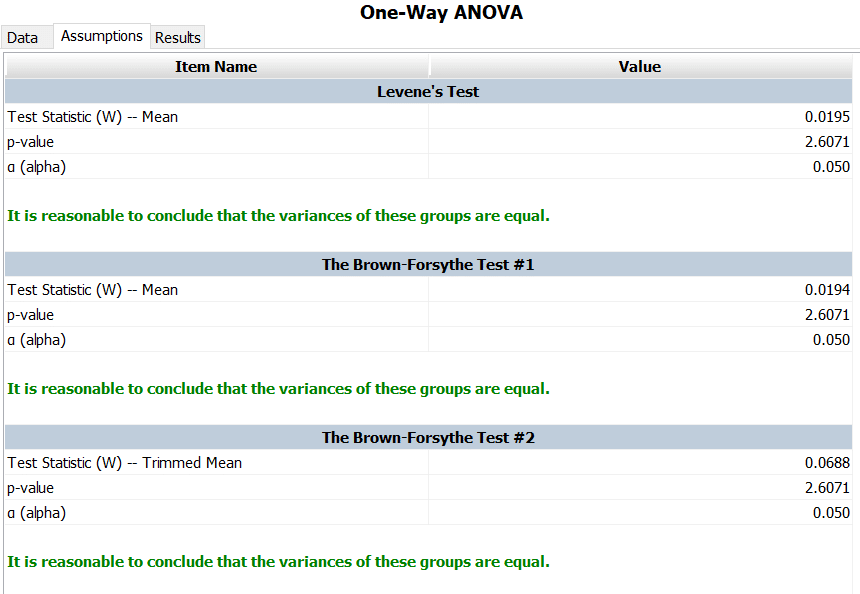
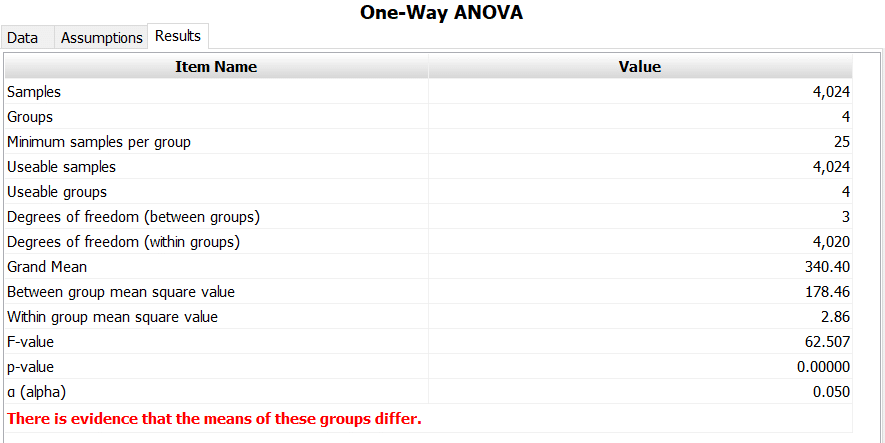
Using WinSPC 10, variables may be subjected to the very useful ANOVA technique of analysis. ANOVA, which stands for Analysis of Variance, sorts a variable’s data into meaningful groups (users, stations, etc.) and calculates the mean for each group. Significantly different group means are a hint that the groups may warrant further investigation. It’s a fantastic way to quickly home in on opportunities for improvement and, eventually, root causes. (There are different types of ANOVA studies. The one available in WinSPC 10 is One-Way ANOVA.)
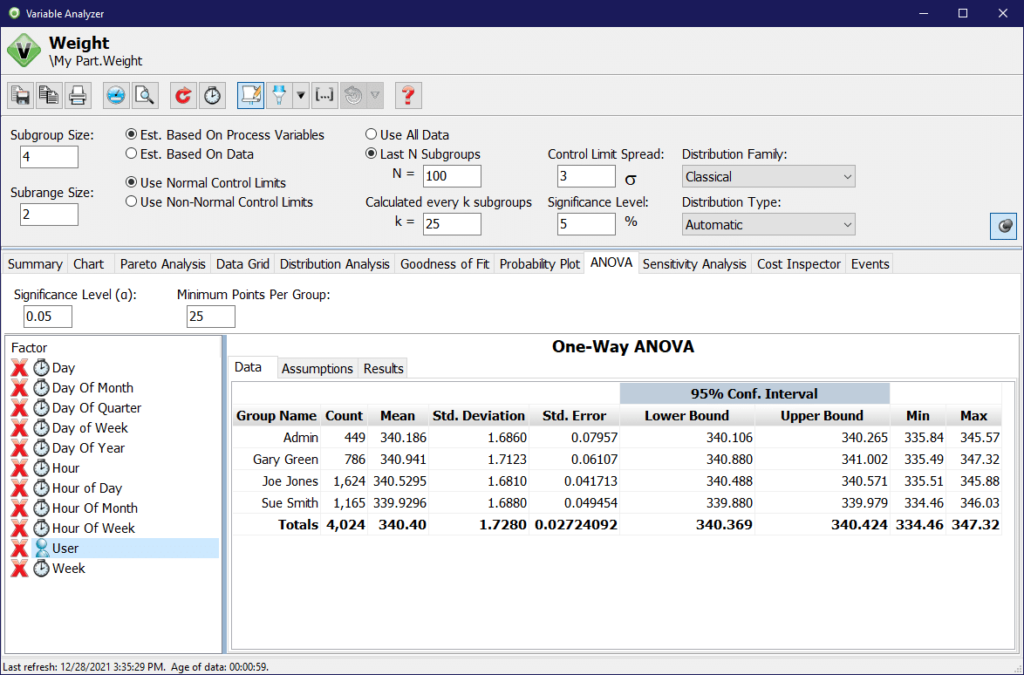
- View test-backed assumptions that can be made about the groups’ variances and isolate what group or groups warrant a deeper look
- Examine a set of results to guide further investigation about the variable
Global Templates and Favorites — Common Tags
Common tags simplify administration with templates spanning multiple products or families.
Common tags are tags that are created independently of any part and can be linked to multiple parts or part folders. They reduce setup and management effort, allowing you to configure the tag once and link it to as many parts or part folders as necessary. Like regular tags, common tags also streamline analysis by enabling you to quickly do things like create a data set that isolates all the parts that share a common tag value.
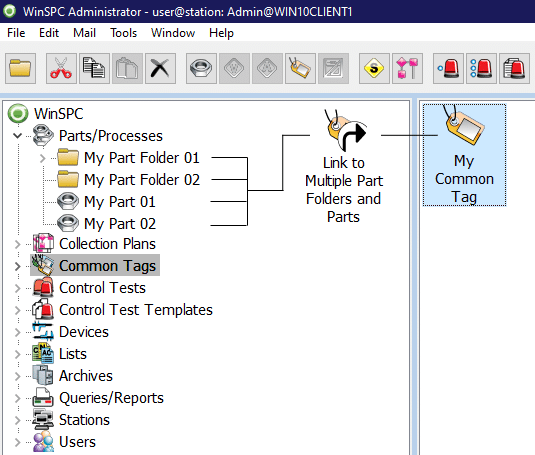
- Define tag templates and link tags across multiple products for quick deployment and easy configuration
- Ensure tags are used in a standard way and with standardized values to maximize data analysis effectiveness later
- Allow more rapid creation, expansion and change to product families
- Quickly build data sets for analysis leveraging common tags that span multiple otherwise unrelated contexts
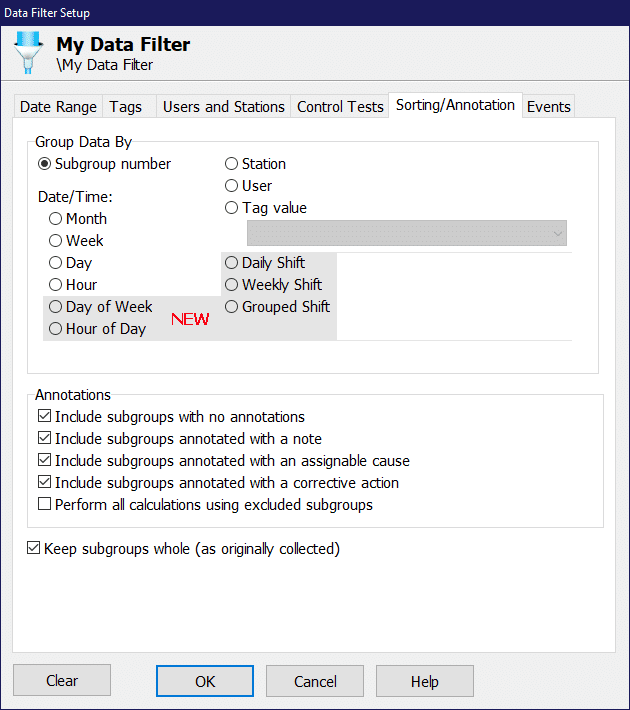
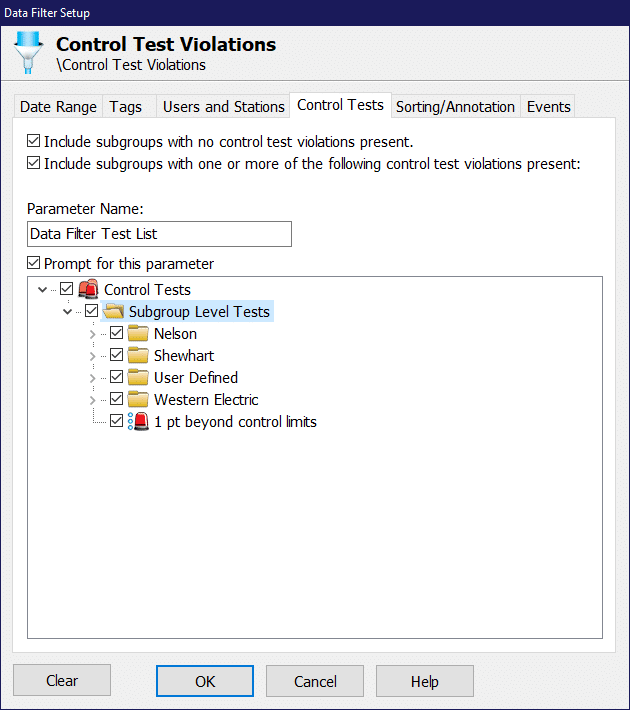
Global Templates and Favorites — Independent Data Filters
Global data filters permit quick application of standard analysis parameters to promote rapid reuse and quick access to common definitions.
Following the lead of common tags, data filters in WinSPC 10 can be created independently of data sets. This permits administrators to create a data filter once and have it used by as many data sets and users as desired, eliminating the need to recreate a particularly useful data filter and ensuring the right filtering criteria is always applied.
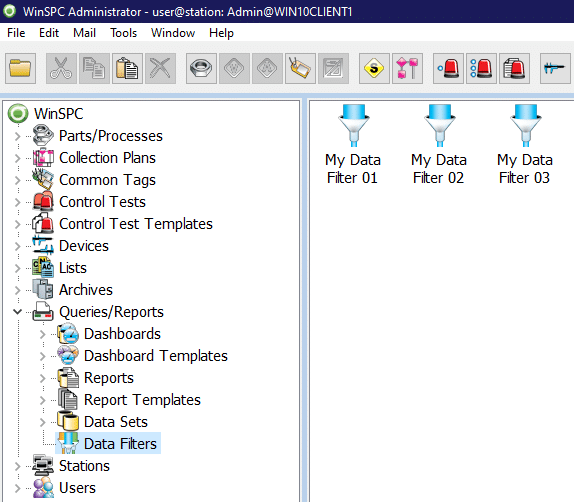
Additional refinements allow greater granularity in filter creation and new predefined filter ranges such as Shift are now included.
- Leverage new options for grouping data by date, time, and shift
- Create standard global data filters that reflect company or team goals for quick and reliable reuse in any new analysis scenario

- Allow the experts to define filtering templates for operators to apply to future data sets and reports whenever needed
- Reduce the time to create large iterations of related data sets and to apply changes to existing data filters and their dependent data sets
Global Templates and Favorites — Speedy Reuse with Favorites
Lists of favorite dashboard templates and report templates–accessible in all the relevant places–make it even easier for a user to visualize a body of data in his or her preferred way.
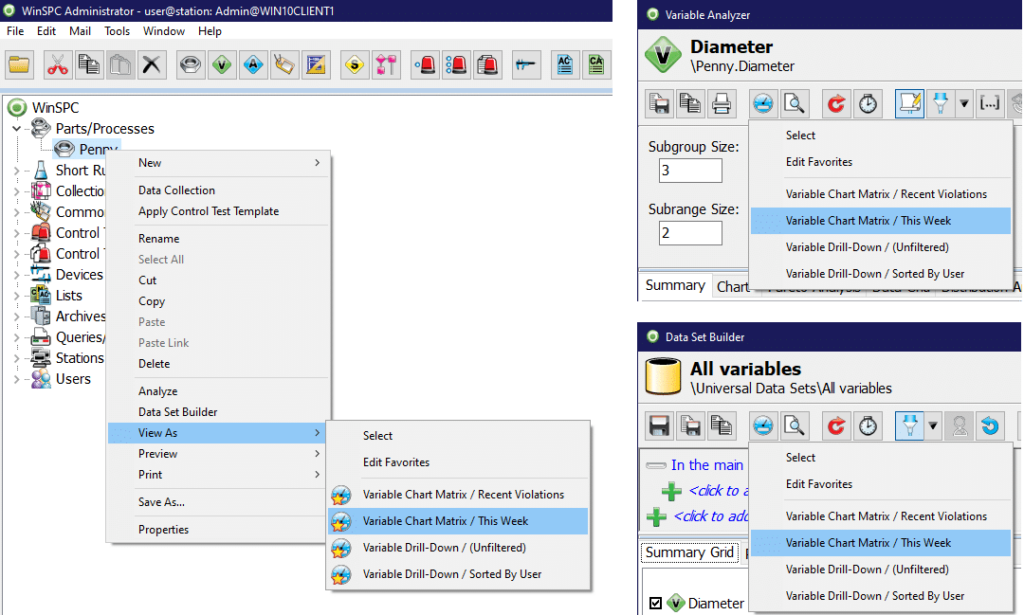
Whether in WinSPC’s Administrator window (above left), an analyzer (above top right), the Data Set Builder (above bottom right), or any other window where it makes sense, a user’s own personalized list is a quick click or two away.
- New templates are added to a favorites list with a simple checking of a check box
- Favorite dashboard templates and report templates can be paired with a data filter or left unfiltered
- Users get to answers faster, not having to make additional mouse-clicks, scan longer lists, or navigate to other windows
- Reduces errors such as inadvertently selecting a wrong template or neglecting to employ a data filter
- Encourages more analysis
- Lists of favorites can be edited anywhere they are seen