Can I chart deviation-from-target, and when would it make sense to do this?

August 18, 2023
3 min read
General

Yes, you can chart deviation-from-target. You do this by creating a Target chart, a chart that plots the deviation of subgroup values from a target value.

Target charts are popular in operations that have low-volume runs. The reason for this concerns the amount of data. To be statistically valid, many chart types, such as capability charts, require more data than is available in low-volume runs. Target charts are valid with small data sets and thus are appropriate for low-volume runs.

Another reason to use Target charts is to simplify things for an operator. For example, if an operator works on 30 different parts in a shift he or she could review 30 separate capability charts. Using a Target charts, rather than having to look at 30 separate charts, he or she can monitor the deviation of each part from its target on a single chart.

To setup a Target chart using WinSPC:

  1. On the Administrator screen, double-click the variable for which you want to setup a Target chart. (This procedure assumes the variable is fully defined, meaning the subgroup size, target and all other such settings are specified.)
  2. In the Variable Setup dialog box that is displayed, click the Advanced button.
  3. In the new Variable Setup dialog box that appears, click the Settings tab.
  4. At the bottom of the Settings tab, check the Calculated check and then click the Equation… button.
  5. In the Equation Builder that appears:
    a) In the Variables list (the rightmost list in the top half of the tab), double-click Self. This copies Self to the Calculation Text area in the bottom half of the tab. (Self refers to the variable being set up to have its deviation-from-target charted.)
    b) In the Operators list, double-click the minus sign. (The minus sign is the first item in the list.)
    c) In the Variables list, double-click Self again.
    d) In the Statistics list, scroll to and double-click Target. The content in the Calculation Text area now reads: Result = Self-Self.Target.
    e) Click the OK button. This causes the Equation Builder to close.
  6. Click the OK button in the Variable Setup dialog box.

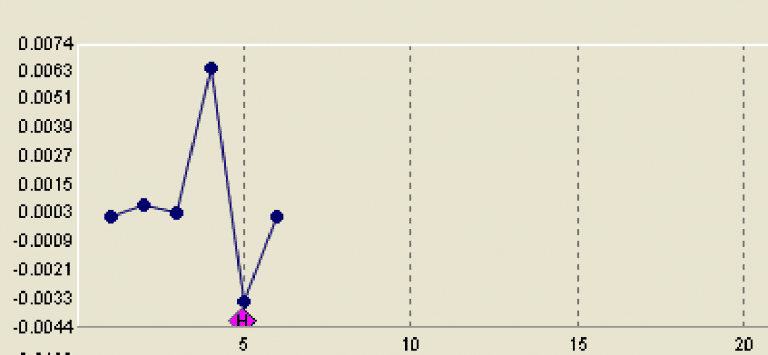
Once this setup is complete, data for the variable can be collected normally. The chart associated with the variable will illustrate the extent to which subgroup values are higher or lower than the target value.

Grace Barton Avatar

Grace Barton

Marketing Specialist

Grace Barton is a digital marketing and competitive intelligence professional who crafts strategic narratives by bridging marketing insights with analytical expertise. At Advantive, she creates engaging, data-driven content tailored to the distribution, manufacturing, packaging, and quality industries. Her goal is to deliver impactful messaging that drives engagement and growth based on specific gap closure needs, whether responding to sales organization requirements, pinpointing gaps in content, or meeting immediate market trends.
She thrives on transforming competitive intelligence into actionable insights for the sales organization. Grace manages Advantive's competitive intelligence platform, Klue, to equip the sales team with the battlecards and market data they need to stay ahead of competitors. Since launch, she's built 28+ battlecards across four lines of business, ensuring the GTM strategy stays sharp.
Grace has a passion for leveraging market insights with storytelling to guide strategic decision-making, empower sales organizations, and nurture organizational growth.

Areas of Expertise: Digital Marketing, Competitive Intelligence, Strategic Narratives, Marketing Insights, Analytical Expertise
Fact Checked & Editorial Guidelines

Our Fact Checking Process

We prioritize accuracy and integrity in our content. Here's how we maintain high standards:
  1. Expert Review: All articles are reviewed by subject matter experts.
  2. Source Validation: Information is backed by credible, up-to-date sources.
  3. Transparency: We clearly cite references and disclose potential conflicts.
Your trust is important. Learn more about our Fact Checking process and editorial policy.
Reviewed by: Subject Matter Experts

Our Review Board

Our content is carefully reviewed by experienced professionals to ensure accuracy and relevance.
  • Qualified Experts: Each article is assessed by specialists with field-specific knowledge.
  • Up-to-date Insights: We incorporate the latest research, trends, and standards.
  • Commitment to Quality: Reviewers ensure clarity, correctness, and completeness.
Look for the expert-reviewed label to read content you can trust.