
Before applying statistical methods that assume normality, it is necessary to perform a normality test on the data.

Figure 1: Histogram depicting a normal (bell-shaped) distribution in WinSPC
For example, all of the following statistical tests, statistics, or methods assume that data is normally distributed:
• Hypothesis tests such as t tests, Chi-Square tests, F tests
• Analysis of Variance (ANOVA)
• Least Squares Regression
• Control Charts of Individuals with 3-sigma limits
• Common formulas for process capability indices such as Cp and Cpk
WinSPC Means Lower Costs and Higher Quality
WinSPC is software to help manufacturers create the highest quality product for the lowest possible cost. You can learn more here.
Before applying statistical methods that assume normality, it is necessary to perform a normality test on the data (with some of the above methods we check residuals for normality). We hypothesize that our data follows a normal distribution, and only reject this hypothesis if we have strong evidence to the contrary.
While it may be tempting to judge the normality of the data by simply creating a histogram of the data, this is not an objective method to test for normality – especially with sample sizes that are not very large. With small sample sizes, discerning the shape of the histogram is difficult. Furthermore, the shape of the histogram can change significantly by simply changing the interval width of the histogram bars.
Normal probability plotting may be used to objectively assess whether data comes from a normal distribution, even with small sample sizes. On a normal probability plot, data that follows a normal distribution will appear linear (a straight line). For example, a random sample of 30 data points from a normal distribution results in the first normal probability plot (Figure 2). Here, the data points fall close to the straight line. The second normal probability plot (Figure 3) illustrates data that does not come from a normal distribution.
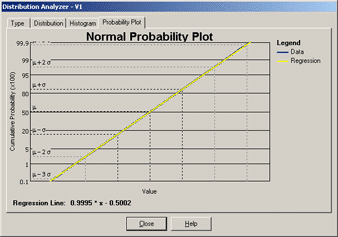
Figure 2: Normal probability plot illustrating normal distribution
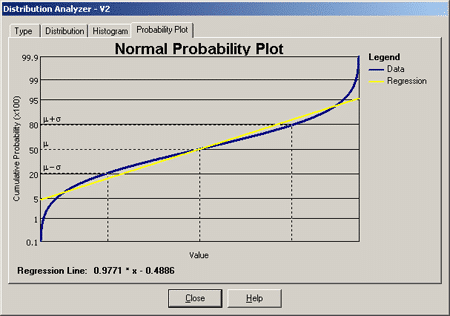
Figure 3: Normal probability plot illustrating non-normal distribution
Many methods are available to handle non-normal data and these should be utilized when necessary. Applying methods which assume the normal distribution when this assumption is not valid often results in incorrect conclusions.
Steven Wachs, Principal Statistician
Integral Concepts, Inc.
Integral Concepts provides consulting services and training in the application of quantitative methods to understand, predict, and optimize product designs, manufacturing operations, and product reliability. www.integral-concepts.com
Download the white paper on how to jump-start a “mini” Six Sigma Quality program on a budget
About DataNet Quality Systems
DataNet Quality Systems empowers manufacturers to improve products, processes, and profitability through real-time statistical software solutions. The company’s vision is to deliver trusted and capable technology solutions that allow manufacturers to create the highest quality product for the lowest possible cost. DataNet’s flagship product, WinSPC, provides statistical decision-making at the point of production and delivers real-time, actionable information to where it is needed most. With over 2500 customers worldwide and distributors across the globe, DataNet is dedicated to delivering a high level of customer service and support, shop-floor expertise, and training in the areas of Continuous Improvement, Six Sigma, and Lean Manufacturing services.
Our Fact Checking Process
We prioritize accuracy and integrity in our content. Here's how we maintain high standards:- Expert Review: All articles are reviewed by subject matter experts.
- Source Validation: Information is backed by credible, up-to-date sources.
- Transparency: We clearly cite references and disclose potential conflicts.
Our Review Board
Our content is carefully reviewed by experienced professionals to ensure accuracy and relevance.- Qualified Experts: Each article is assessed by specialists with field-specific knowledge.
- Up-to-date Insights: We incorporate the latest research, trends, and standards.
- Commitment to Quality: Reviewers ensure clarity, correctness, and completeness.